Market Update April 2023

In this edition of the Smith Report, we will be talking about 3 things to help you navigate the marketplace:
- Demand based on the rate environment
- What’s happening with home prices ??
- Will we see affordability improve this year ?!
As always, it is a pleasure to be able to serve you and your family. We take our job seriously in doing our best to bring value to your real estate journey. I would like to remind everyone that there is no good news, and there is no bad news. News is just news, in a similar fashion where facts are facts. Anything after that is a matter of perception and a state of mind.
Demand Based on the Rate Environment
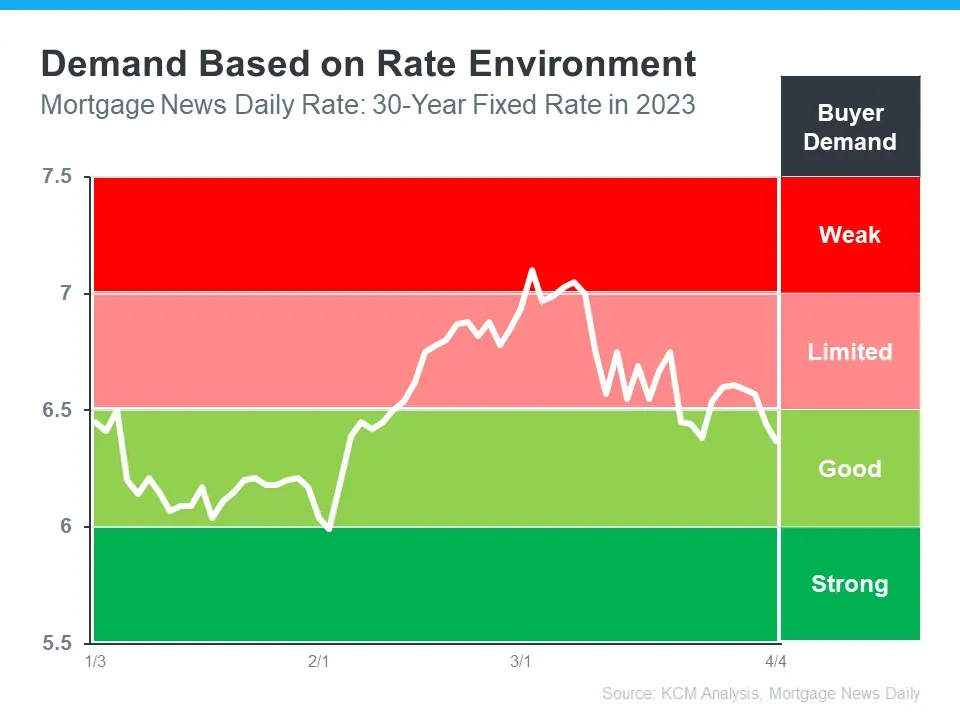
We are actively in a “demand based on the rate†environment. The graph below has been updated from last month to compare with last month's buyer demand based on rates. How do we interpret this?
We have had several significant events happen in the economy recently in the month of March, but overall, we are seeing a positive rate environment and a good buyer demand environment. Sam Kater from Freddie Mac cast a great perspective on the buyer demand environment. He said, “Turbulence in the financial markets is putting significant downward pressure on rates which should benefit borrowers in the short term.â€
As rates come down, housing becomes more affordable. A common misconception we hear a lot is this: “The only way homes will become more affordable this year is if prices come down.â€
This is not necessarily true. There are 3 factors that influence affordability:
- Prices
- Interest rates
- Wages
What's Happening with Home Prices?
Last fall we saw several news headlines relating to prices which drove a lot of indecision and influenced many prospective home buyers to halt their home-buying journey.
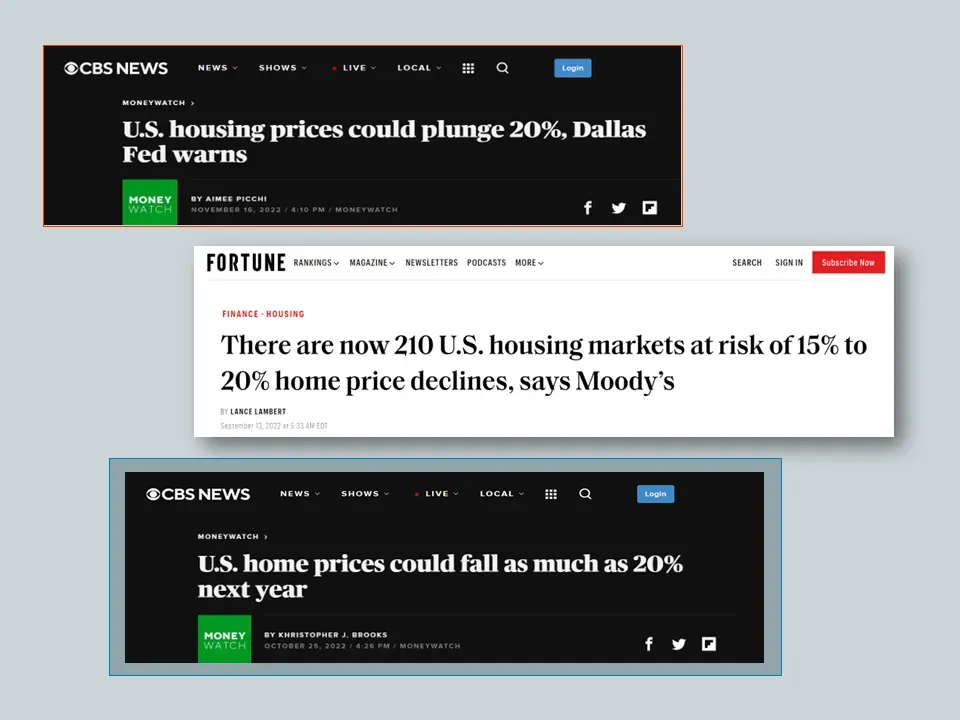
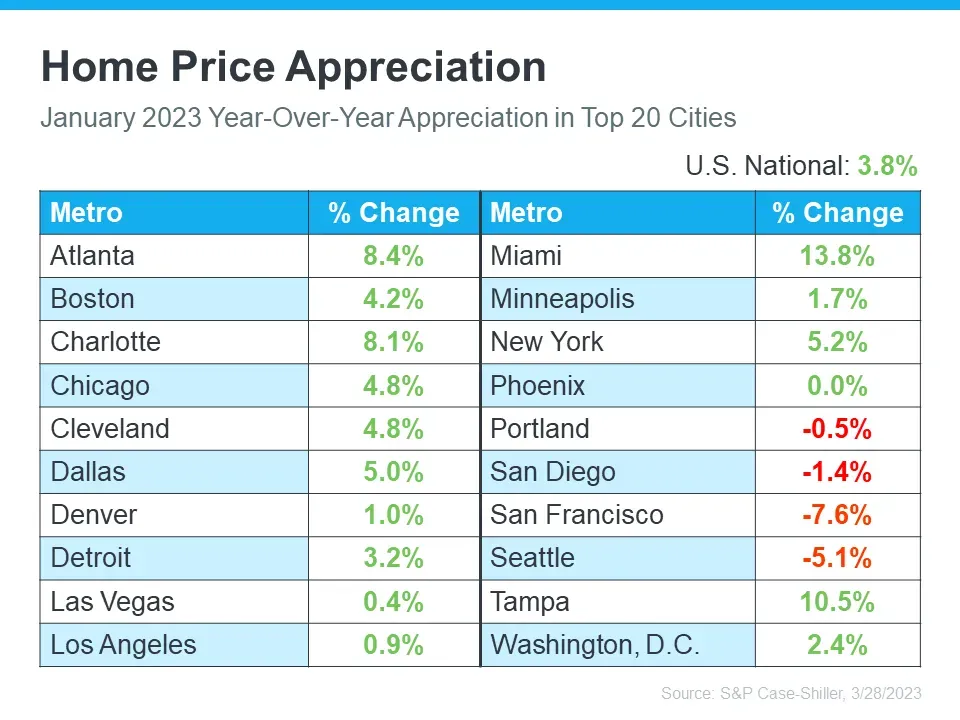
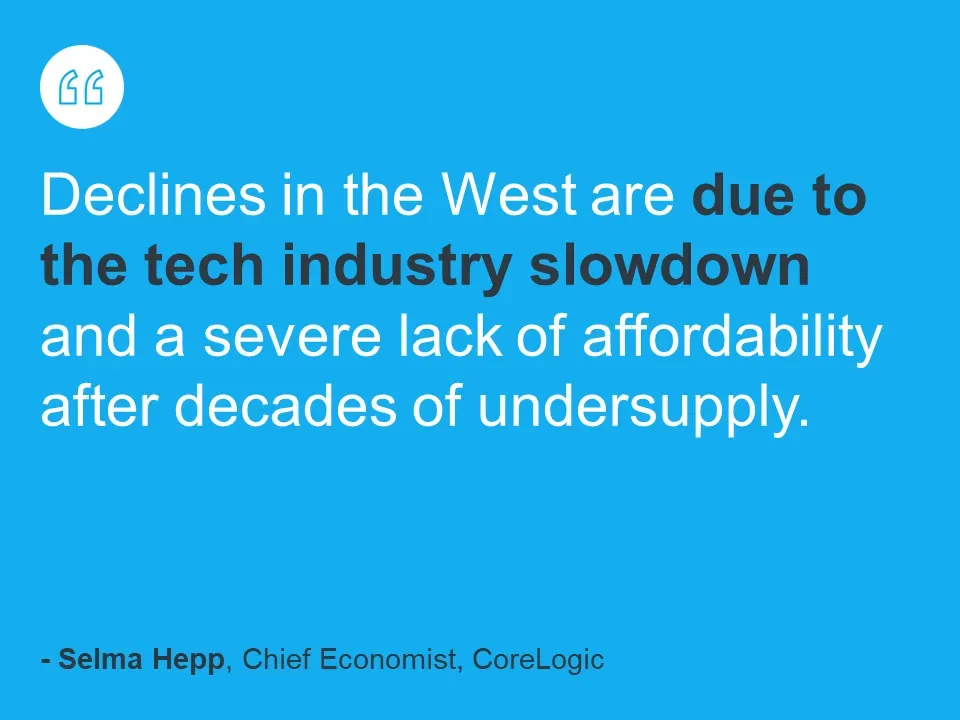
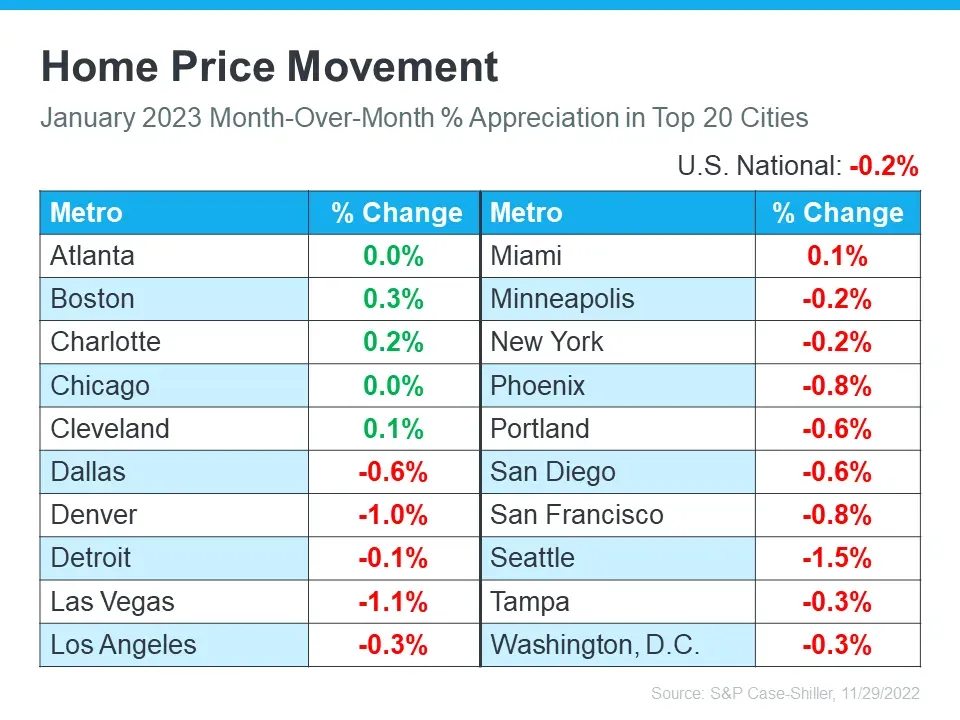
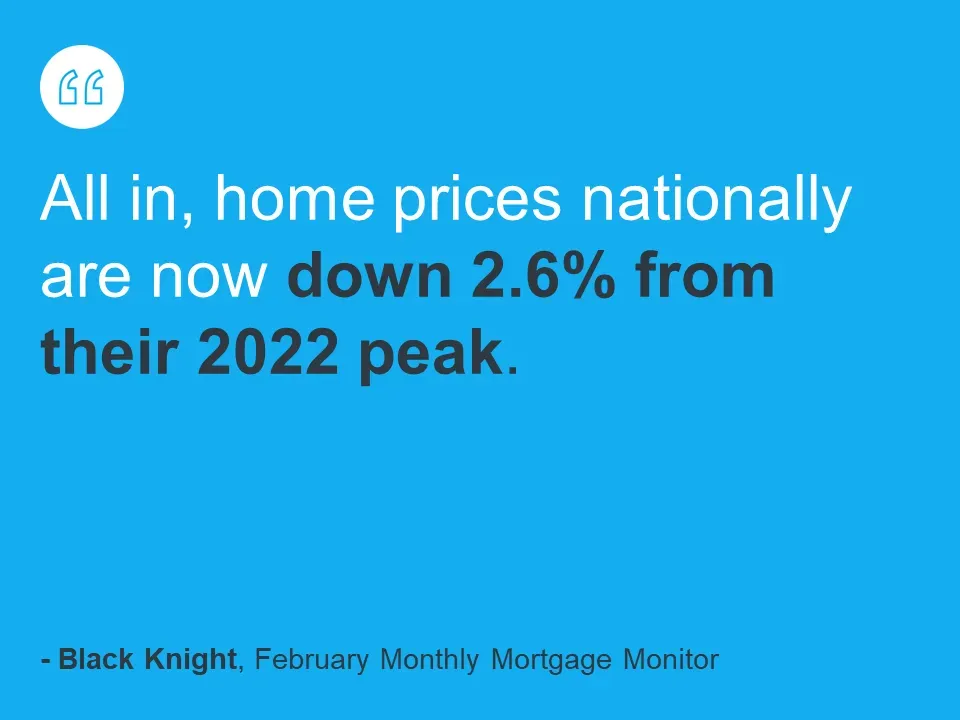
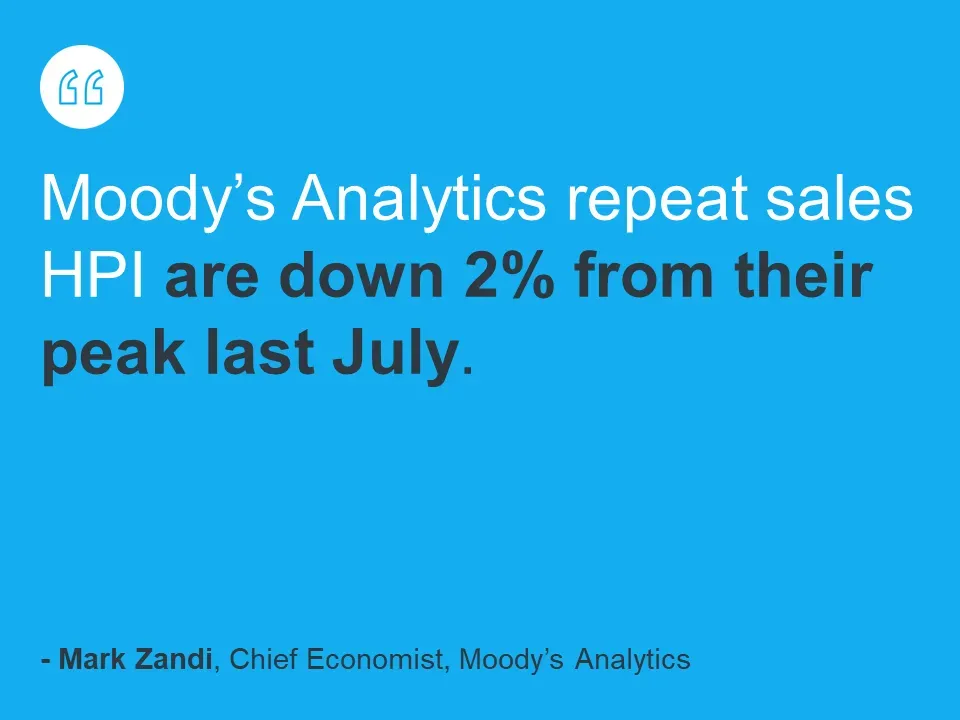
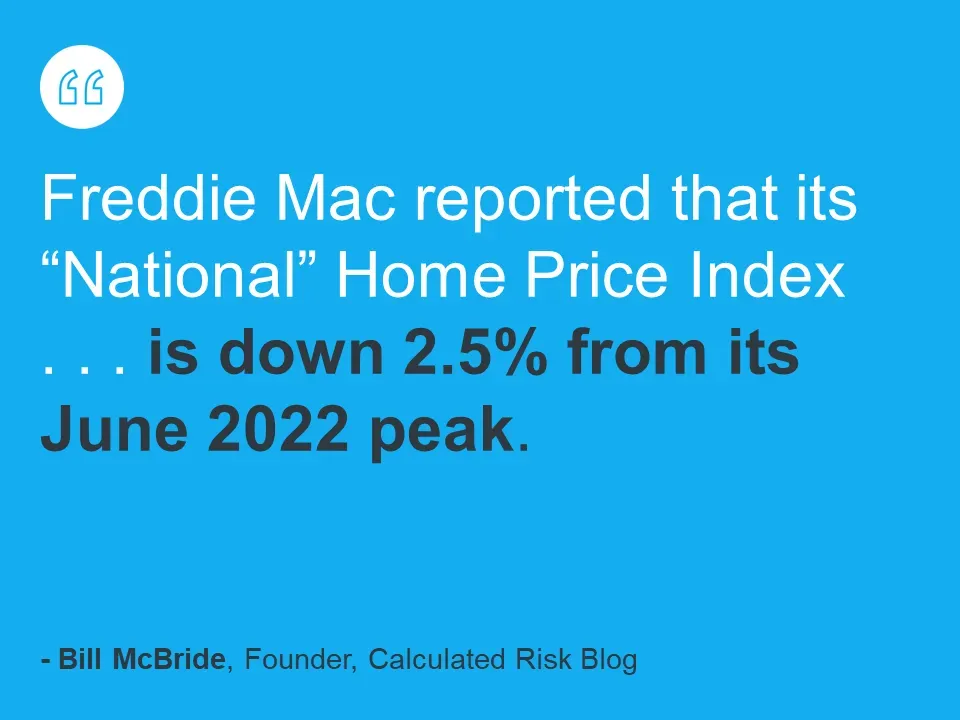
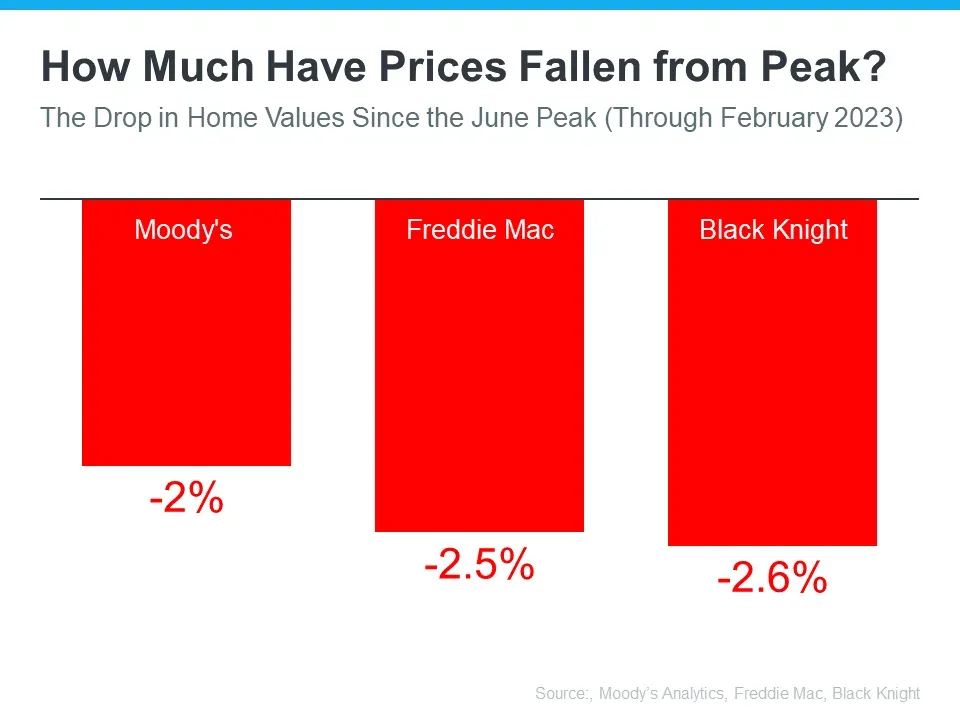
Headlines showcasing a market risk of a 15%-20% drop in value never came to pass. As you can see in the chart below we see a lot more green than red; and the cities that did drop are nowhere near 20%, mostly heavy tech markets in the West Coast. But any figure remotely close to a 20% decline is not happening in the country as the national average clearly reflects.
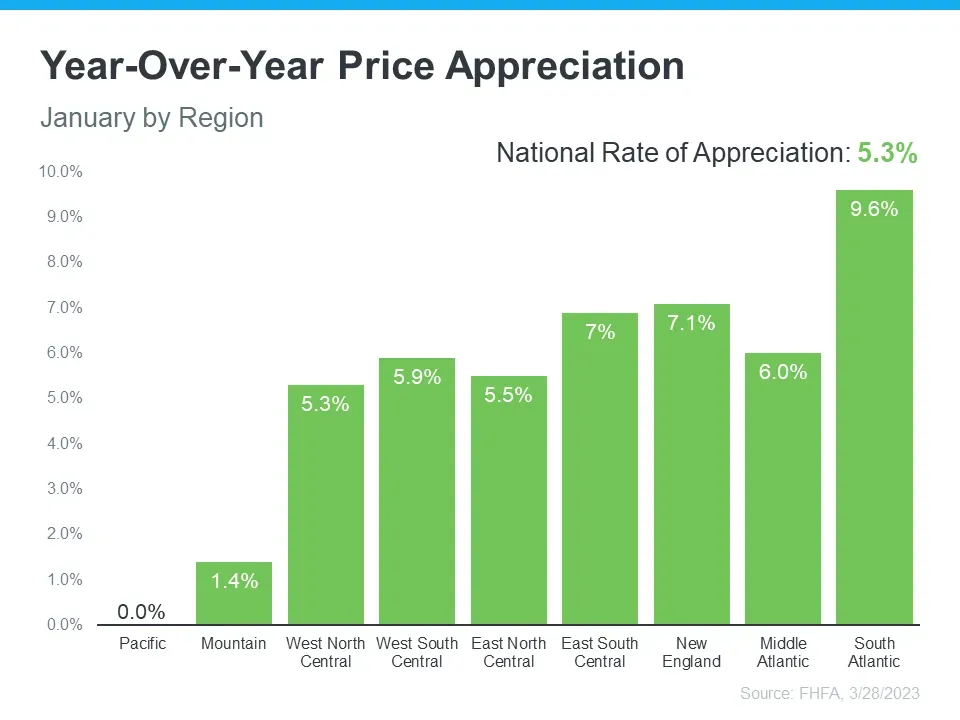
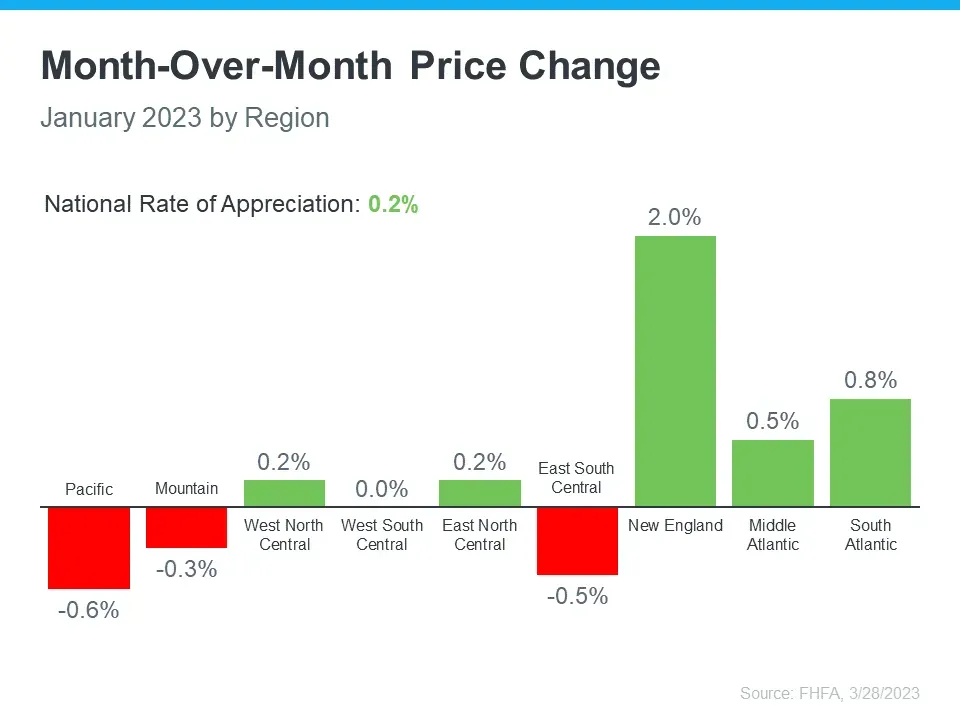
It is important to understand that prices are not at a freefall heading to a “Market Crash.†Yes, month over month does drop a little, but as we look over the long haul prices have continued to go up. As we interpret on a month-over-month basis you will notice the inverse relationship between price and rates. As rates went up, prices went down. You will also notice the historical trend where prices always go up into and through the spring selling season. Month-over-month pricing will always be different. Real estate moves in cycles, and month-over-month is the best view of that cycle.
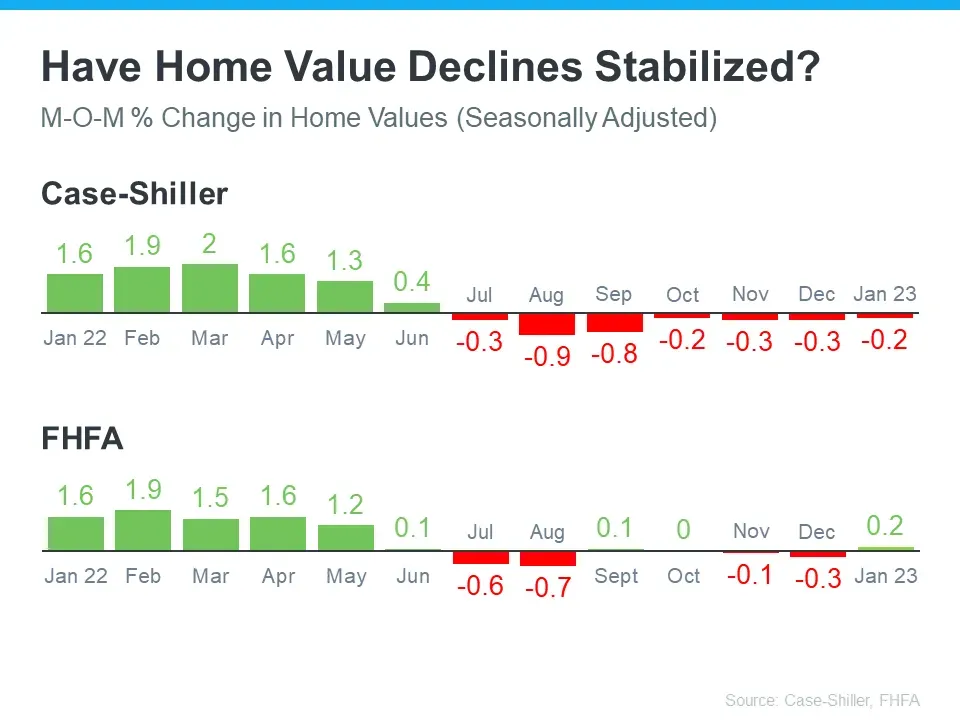
The best response to news headlines is always data, and accurate data always comes in arrears. We are nowhere near what the “Headlinesâ€, “Market Crashâ€, and “Dooms-Dayers†have been preaching. With the statements and data from major industry analytics companies, we can make the case to say that the worst is now behind us. Again, the news does more to terrify than to actually clarify to people.
Will We See Affordability Improve This Year?
So how do we measure affordability? It is a combination of prices, rates, and wages. Being that we have been in a rate-sensitive environment, rates are the biggest driver in affordability.
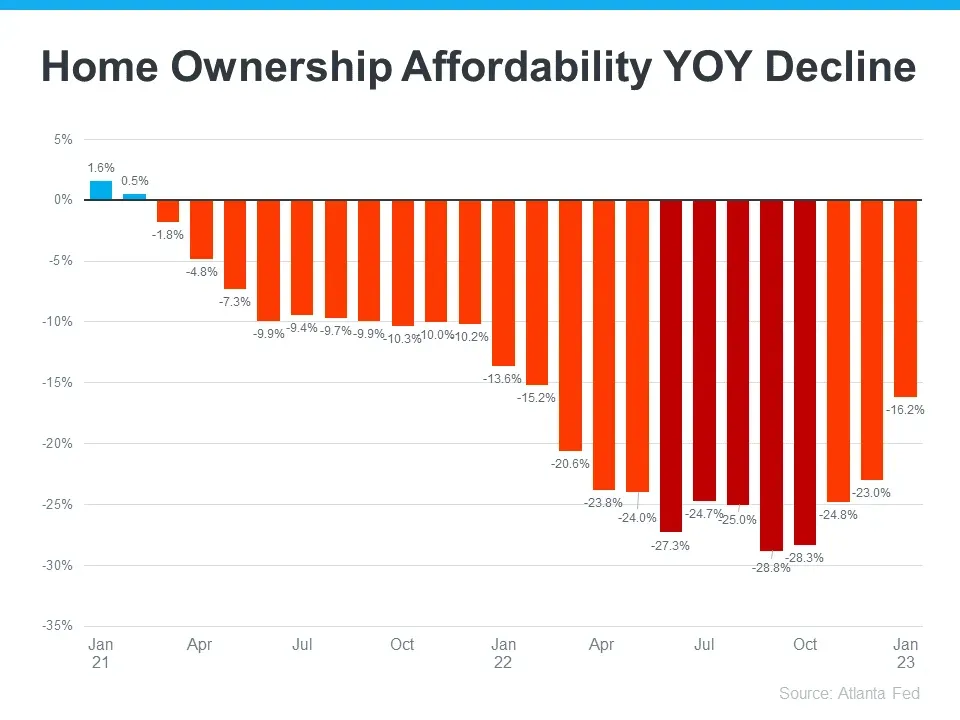
Over the last few months, every time the mortgage rates eased up a little or dropped a full point more and more buyers jumped into the market to buy. Why? More people are able to afford to finance a home because lower rates mean it costs less to finance the loan. So how does this impact affordability? While affordability is still a challenge we are seeing it head in the right direction. As you notice in the chart below, it was more affordable to buy in January 2021 than it was through the following two years during the rate spike, and the peak of the rate spike is in dark red between March 2022 and October 2022.
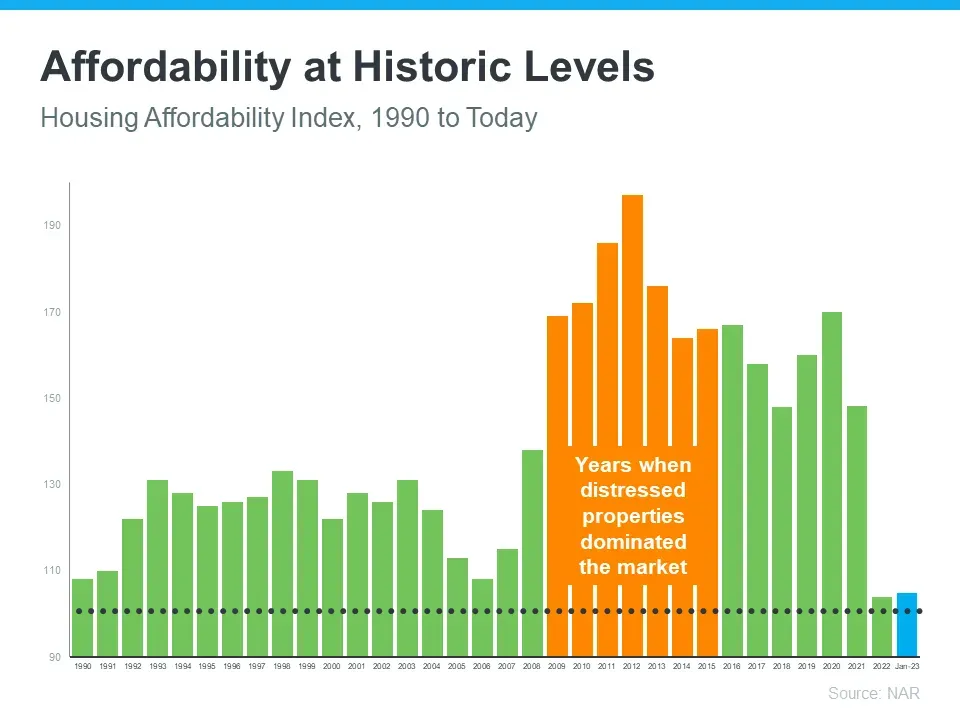
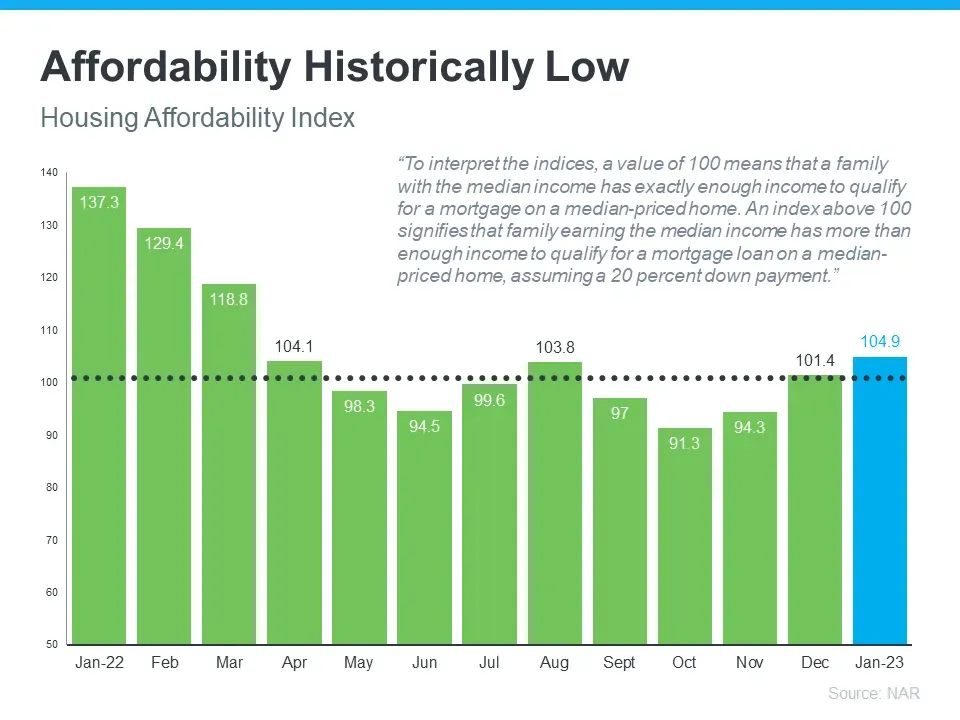
Right now affordability is at a historic low compared to the long haul. In the graph above the higher the bar, the more affordable it is to buy a home. The orange bars reflect the market crash when distressed properties dominated the market. During this period orange prices were the major influencer in affordability. In today's market, the major influencer is rates and wages. In a closer look at this year, you will notice affordability improve in January. In January 2022, it was clearly more affordable to buy just before rates doubled. During the time rates peaked you can notice affordability dropping month-over-month and as rates eased up affordability began to move back up in the right direction. The dotted line at “100†is the threshold for affordability. An affordability index of “100†means that a home buyer making a median income can afford to purchase a median-priced home. When the bar is above this threshold homes are more affordable. When the bar is below the threshold qualifying is more challenging, and so is being able to afford a home.
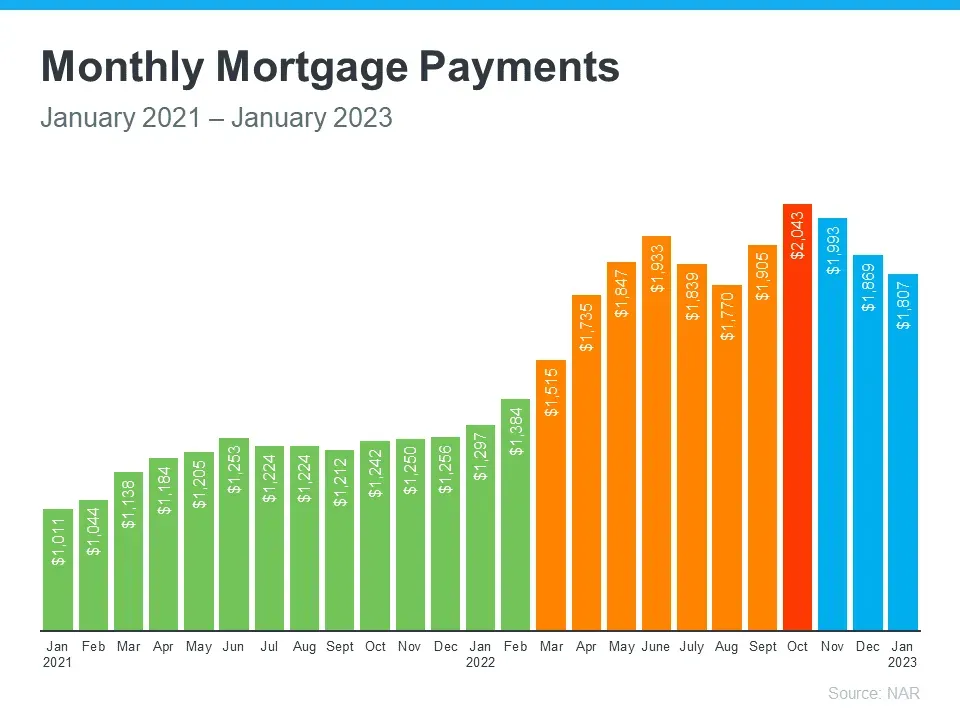
The bottom line, whether it is a rate-sensitive market or anything else, someone who is buying a home needs to be able to make their monthly mortgage payment. It was much easier to make your mortgage payment in 2021 when it was much more affordable to buy a home. Over the last couple of years, the average mortgage payment crept up and peaked in October of 2022 when we were experiencing high rates, just after prices were increasing rapidly. As rates began to ease, prices adjusted & moderating themselves, and wages increased you will notice in blue that the monthly mortgage payment begin to come back down. That $200 difference between October 2022 and January 2023 means your weekly or daily Starbucks run is also affordable.
Every dollar counts in a mortgage payment and every percentage point is the difference that makes the difference. Don’t just look at prices when deciding to buy a house, look at affordability. The price may be right, but affordability may be low.
As your National & Local Experts here is what affordability looks like across the U.S. and the West Coast:
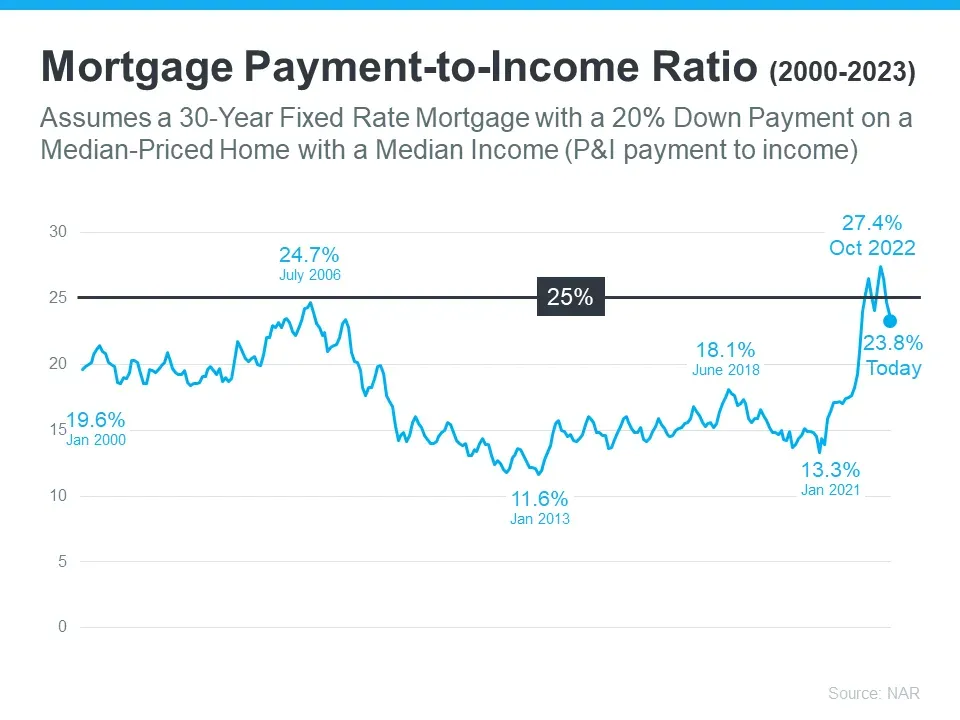
The National Association of Realtors recommends when purchasing a home to spend no more than 25% of your income on principal and interest. The black line across the graph represents 25% median income. The blue line shows what percentage of income goes towards principal and interest. You will notice in January 2000 a normal or healthy market and where mortgage payments were. You continue to see the effects leading into and resulting from N.I.N.A. loans (No Income No Assets Loan) in the 2008 crash, and then you’ll notice the market adjusting and correcting itself between January 2013 - June 2018. And then COVID happened between June 2018 to October 2022. Today we are moving down from that peak in October 2022 and are continuing to head in the right direction below the 25% threshold.
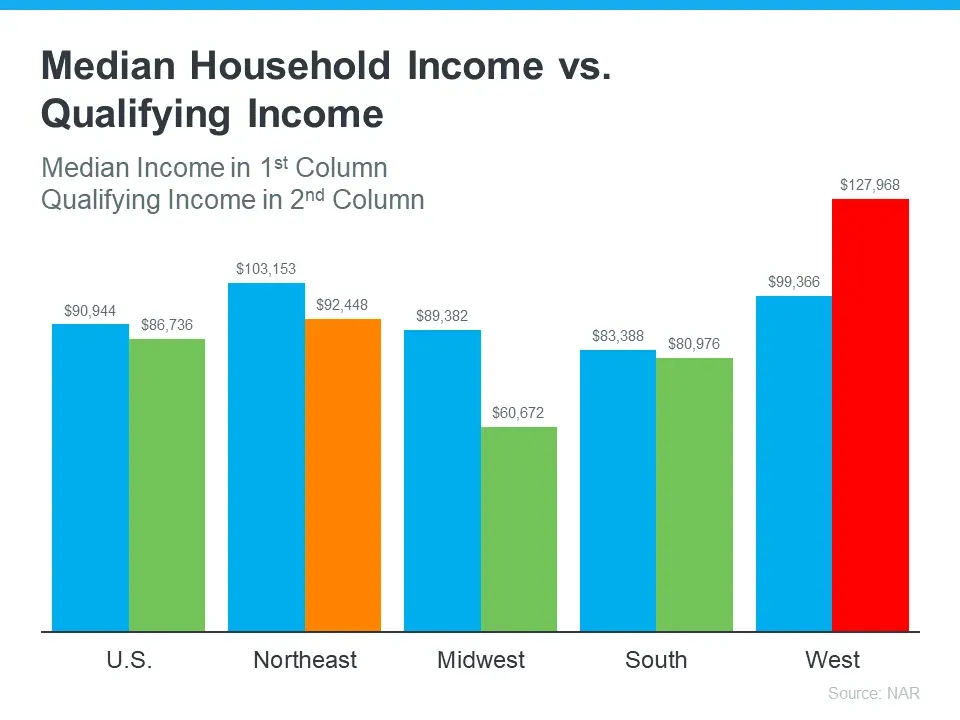
This graph shows that affordability changes as we get more hyper-local. Mortgage rates and wages are the primary drivers in affordability, and price does different things in different markets. The blue bar on the left represents the median income for that region. The bars on the right of the blue bar represent the qualifying income for that region for a median-priced home. You will find the National affordability total average on the far left. What stands out the most is the red bar on the far right. It is much more expensive to purchase on the west coast when it comes to qualifying income than in other markets. This has been the biggest challenge for home buyers and this is where we have been succeeding with our home buyers.
The California Dream for All Program is Gone? Did you Miss It?
Who you work with matters, and we have been assisting our clients create a step-by-step plan to successfully navigate their qualification process and then find our clients a good deal with Off Market Properties. We are a full-service real estate firm. We work only with the best in the industry as a reflection of our clients and who we are as a brand. We have the best lender in the area. A lot of our clients benefited a lot from the California Dream For All Program; it worked very very effectively. For those of you that missed out or were not first-time home buyers for the California Dream For All Program, be sure to take advantage of this opportunity. Our in-house partner lender has a rare program and opportunity to have last year's rates in today’s market. Our clients have been getting between 4%-5% which drastically increased their purchasing power and area they can buy in.
If you are upgrading your home, downsizing, or you missed out on California Dream For All as a first-time home buyer and you are looking for a good deal call now to set up a time so we can help you create a step-by-step plan for your home buying journey. With us, real estate is not a transaction but a journey. And with us, you are not buying a house but a lifestyle. We will also give you exclusive access to Off Market Properties such as Foreclosure, Pre-Foreclosure, For Sale By Owner, and our Exclusive of RBID Homes and other Distressed Sales that are not available online and you won’t find on Zillow, Trulia, or Realtor.com. It’s a free service and, of course, you’re never obligated to buy a home.
If you need to sell in order to buy or are just considering liquidating to have some disposable cash in hand we have 2 very unique programs available for you. For those of you who would like the convenience of the sale without all the hassle of showings, marketing, and preparing the home we have a Cash Offers program. We have been succeeding with our Cash Offers program in getting very close to Fair Market Value on a CASH OFFER within 48 hours. We also have a Guaranteed Sale Program if you are looking to extract the most value from your home with the least amount of cost to you. We are happy to give you a FREE Market Evaluation to determine what your home would sell for. Also, we can give you tips on what to do and what not to do to sell your home for the most amount of money, and we can go over all the various closing costs you will incur so you will know exactly what you will have left in your pocket after all expenses. It’s FREE of charge and obligates you to nothing.
We’ve been hearing a lot of the same feedback that people are waiting for prices to drop AND rates to drop. Not only are you thinking that, but so is everyone else. And if you are waiting for that and you are not already in escrow about to close… you’re missing the opportunity you’ve been waiting for. Here is why:
- Prices and interest rates have an inverse relationship. When prices go up, rates drop. When prices drop, rates go up.
- Both prices and rates only drop together in the midst of an anomaly of a current event such as COVID-19 and Banks closing.
- By the time you hear it in the news, it’s already over and gone. Here’s why, we can only provide data verifying the lowest prices and lowest interest rates during a period of time after the fact. In other words, we only have collected verifiable data after the deals have closed and recorded, and we have new higher prices or rates to compare it to. The information comes in arrears, not in advance.
- Real Estate in America has been going up non-stop for the last 50 years… so we wonder… What are people waiting for… to buy at a more expensive price?
If you wait for prices and you wait for rates to be low to find a good deal, and everybody else who is waiting just like you hear about it in the news after the fact… guess what you have?
Walmart on Black Friday and inventory is absorbed fast, multiple offers, above list price negotiations.
Here is a great story of a great client who decided to stick to the data and trust the process. Just before COVID, our great client was a first-time home buyer back when homes in Anaheim were still $700K on average. The payment was a little bit of a stretch yet all the data points were showing that real estate properties were going to continue to go up. Our client took all the data he had and asked himself… what am I waiting for… he took the leap of faith despite the payment being a little bit of a stretch. Today our great client recalls that memento and keeps reminding us to send him data and information, here's why: Since then his property appreciated to over $1M and he had enough equity to buy more rental properties and collect rent, creating multiple streams of income for himself. He is very very happy about that decision and the only regret he would have had is that he didn’t make the jump and he wouldn’t have had any idea of the type of lifestyle that was waiting for him a few years down the road because of this one purchase that was a little bit of a stretch.
With all the data we have shared it is important to stick to the facts. Media sells, fear sells, and negativity sells. Always keep in mind what the whole story is. All too often we make decisions on content without the full context. We would like to close this edition of The Smith Report by wishing you all continued success in all your endeavors this 2023!
Don’t be easily swayed or fooled by the headlines of the news. Fake news headlines are made to sell news by people who don’t understand or work in the real estate market. Remember that those are news stories, fake news, and that negativity sells not the heroic events of our military, law enforcement, paramedics, firefighters, doctors, and nurses.
Seek the reality of the situation.
As always, we are not here to hustle you, we are not here to sell you… We are here to inform you, we are here to serve you, and we are here to help.
We are more than happy to provide you with exclusive access to off-market properties such as foreclosure, pre-foreclosure, for-sale-by-owner, and our exclusive RBID Homes and other distressed sales that you won’t find on Zillow, Trulia, or Realtor.com.
We are more than happy to provide you with a free market evaluation to determine what your home would sell for. Also, we can give you tips on what to do and what not to do to sell your home for the most amount of money, and we can go over all the various closing costs you will incur so you will know exactly what you’ll have left in your pocket after all expenses.
If you are looking to buy now or sell now, we are always available to provide the most accurate market evaluation and create the most detailed step-by-step plan for your successful home-buying journey.
Feel free to give us a call at (714) 844-5696.